
Most Americans Don’t Know How Social Security Works—And It Affects Their Reform Perceptions
The results of Cato’s Social Security survey are in


To accompany the release of our book, Reimagining Social Security: Global Lessons for Retirement Policy Changes—which will be out in two days (August 12)—the Cato Institute surveyed 2,200 Americans to assess their understanding of Social Security and their views on potential reforms to improve the program’s financial outlook.
One reform we explored in depth in the book is transitioning to a flat, anti-poverty benefit structure. This survey was designed to test what Americans know about Social Security’s current structure and whether they might support such a shift.
While responses vary by factors such as age, two clear patterns emerge: most Americans don’t know key aspects of the program, and many are open to structural reform. For a more detailed breakdown of the survey results, see this blog from Cato’s Emily Ekins and Hunter Johnson.
Misconceptions About How Social Security Works
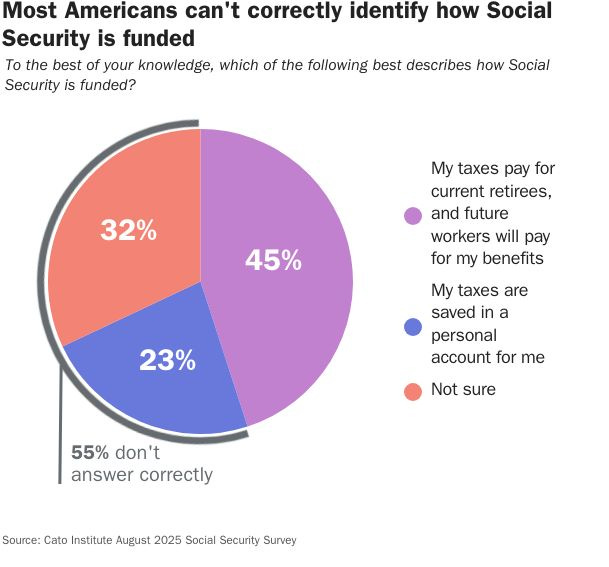
Less than half (45 percent) of respondents correctly identified the program’s pay-as-you-go (PAYG) design, in which current workers’ taxes fund current retirees’ benefits. Twenty-three percent (23 percent) mistakenly believe their payroll taxes are saved in personal accounts, while 32 percent are unsure how the program is funded (see chart below). This widespread misunderstanding is troubling, as the PAYG structure is one of the main factors driving the program to insolvency, as fewer workers are supporting more retirees.
Worryingly, just 25 percent of those aged 18-29 answered this question correctly, while 34 percent believe their taxes are saved in personal accounts. This misconception can hinder effective retirement planning, as young workers may fail to set aside enough in private savings, assuming Social Security is already doing that for them.
While Americans lack an understanding of the program’s funding structure, they are more familiar with how benefits are calculated. Sixty percent (60 percent) correctly recognize that retirees who paid more in payroll taxes will receive higher benefits, compared to 15 percent who think everyone receives the same amount (25 percent are unsure). However, the share of correct responses improves by age, likely because older individuals are receiving or nearing receipt of benefits and are more informed about the process.
That said, a significant portion of respondents underestimated the size of the benefits. When asked to estimate the average Social Security benefit ($23,712), 38 percent guessed too low, 25 percent answered correctly, 17 percent overestimated, and 19 percent were unsure. A similar pattern appeared when asked about the maximum annual benefit ($61,296 for someone retiring at 70): only 9 percent answered correctly, while 59 percent underestimated. Even if respondents interpreted the question as referring to the maximum benefit at full retirement age ($48,216), 30 percent still underestimated, with only 18 percent answering correctly.
The underestimation of Social Security benefits may partially explain why a majority of Americans (55 percent) think Social Security’s main purpose should be to replace seniors’ incomes, while only 45 percent view it as a program to ensure no one falls below the poverty line. If more Americans were aware of how generous benefits can be—especially for higher earners— support for an earnings-related design might be lower.
Additionally, Americans’ views on Social Security’s purpose could be partially attributed to their misconceptions about senior wealth, leading them to believe seniors are financially worse off than they actually are. When asked to compare the wealth of seniors (aged 65-74) to that of younger Americans (35-44), only 26 percent correctly said seniors have more wealth; 31 percent think the two groups have about the same wealth, and 43 percent think seniors have less wealth. In reality, Americans aged 65-74 have three times the median net worth of those aged 35-44: $410,000 vs. $136,000.
Interestingly, younger Americans are much less likely to hold this misconception: just 27 percent of 18-29-year-olds and 32 percent of 30-44-year-olds believe seniors have less wealth, compared to 50-57 percent among older respondents. This may explain why 18–29-year-olds are the only age group in which a majority (52 percent) think Social Security’s main purpose should be anti-poverty protection rather than replacing lifetime earnings.
Americans’ Views on Social Security Reform
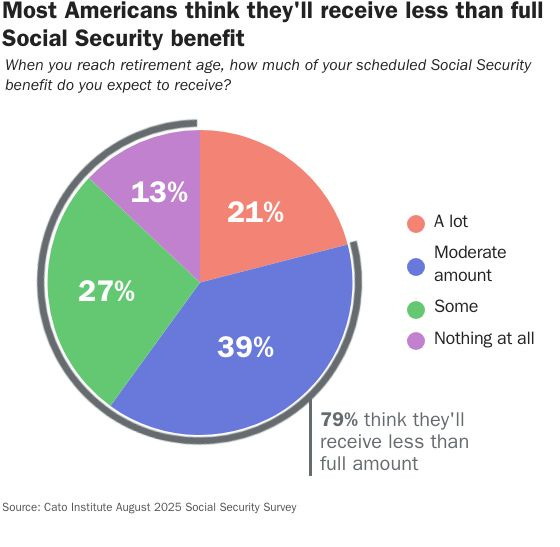
Notably, Americans are aware of the program’s financial challenges. Just 23 percent say they haven’t heard anything about Social Security’s looming insolvency. A combined 77 percent had heard at least “some” information about it. This is reflected in benefit expectations: only 21 percent of Americans believe they’ll receive a “lot” of their scheduled benefits (see chart below).
Younger adults are especially pessimistic. Among 18–29-year-olds, 16 percent expect to receive nothing at all—rising to 20 percent among those aged 30–44. In contrast, only 9 percent of those aged 55-64 and 3 percent of those 65 and older expect to receive nothing, which is understandable given that some of them are already receiving scheduled benefits and that Social Security reform would primarily affect the younger generations.
When asked what action they would prefer the government to take to avoid looming insolvency and benefit cuts in 2033, 37 percent supported raising taxes, 28 percent favored reducing benefits, and 35 percent preferred borrowing. Support for tax hikes rises sharply with age: only 20 percent of adults aged 18–29 support this option, compared to 57 percent of those 65 and older. This is to be expected, as younger workers would bear the cost of tax increases. Specifically, if payroll tax increases are chosen to avoid insolvency, a new worker entering the workforce in 2025 could lose $110,000 in lifetime earnings. Conversely, younger adults are far more open to reducing benefits: 48 percent of 18–29-year-olds support benefit cuts, compared to just 17 percent of those aged 55–64 and 12 percent of those above the age of 65.
Support for borrowing is more consistent—around one-third across all partisan and age groups (e.g., 33 percent of Democrats and Republicans alike; 33 percent of adults aged 18–29 and 31 percent of those aged 65 and older). This may reflect a classic case of fiscal illusion, where borrowing, which is partially deferred to future taxpayers, feels less painful than immediate tax hikes or benefit cuts. That said, if the survey had mentioned Social Security’s $28 trillion unfunded obligation over the next 75 years, preference for more borrowing could have been much lower.
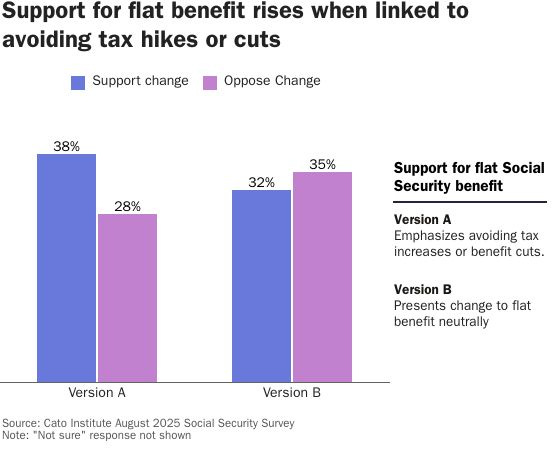
To test openness to a fundamental reform, the survey asked about replacing the current system with a flat monthly benefit of $1,800 for all retirees—raising benefits for low earners and reducing them for high earners. In one version, the proposal was framed as a way to avoid tax hikes or benefit cuts—under which 38 percent supported it, 28 percent opposed it, and 34 percent were unsure. In a second version, framed as offering equal benefits regardless of prior earnings, support was lower at 32 percent, with 35 percent opposing and 33 percent unsure (see chart below).
Support for a flat benefit (regardless of framing) is strongest among younger age groups—the very individuals most likely to be affected if such a reform is enacted. Under the first framing (as a way to avoid tax hikes or benefit cuts), support stands at 44 percent among adults aged 18–29 (22 percent oppose), 35 percent among those aged 30–44 (26 percent oppose), and 44 percent among the 45–54 age group (18 percent oppose). Support remains strong for the 55-64 age group, with 41 percent in favor and 25 against. However, among seniors aged 65 and older, support drops to 30 percent, while 44 percent oppose the change.
Under the second framing (as offering a uniform benefit regardless of prior earnings), 35 percent among 18–29-year-olds and 41 percent among those aged 30–44 support the reform (25 percent and 24 percent oppose, respectively). These results suggest that younger Americans may be more open to a simplified, basic benefit structure—particularly if framed as a way to avoid further burdens from a failing system.
As Social Security approaches insolvency, the urgency for reform is growing. But achieving meaningful reform requires a well-informed public and policymakers who understand how the program truly operates. That’s why we’re doing our part to inform Americans about how Social Security really works, what the consequences of inaction look like, and how a flat benefit structure could offer a more fiscally sustainable path forward. Through blogs, policy papers, and our upcoming book, we aim to replace misconceptions with evidence-based clarity—and spark an honest conversation about the future of Social Security and the broader retirement system of the United States.
Note: We also conducted a small survey among readers of The Debt Dispatch, and the results suggest our audience is both better informed about Social Security and more supportive of reform. All 59 respondents correctly identified the program’s pay-as-you-go funding structure, and 98 percent knew that those who pay more in taxes receive higher benefits. Nearly four in five (78 percent) said Social Security’s main purpose is to prevent senior poverty rather than replace incomes. In addition, 80 percent have heard a “lot” about the program’s looming insolvency, and 97 percent correctly recognized that seniors have more wealth. More than half (54 percent) correctly identified the average Social Security benefit, and 36 percent correctly identified the maximum. This likely reflects our consistent focus on these issues.
Sixty-nine percent (69 percent) preferred reducing benefits to address the program’s shortfall, compared to 27 percent who favored raising taxes and just 3 percent who supported more borrowing. Support for transitioning to a flat benefit of $1,800 was also notably higher: 44 percent supported the change, 37 percent opposed, and 19 percent were unsure. While not nationally representative, these results reflect the perspectives of an audience more engaged with Social Security policy—one that recognizes the need for structural change.