Debt Digest | The Untold Story of Inequality: Growth, Redistribution, and Misleading Stats
Links & Fiscal Facts


We’re hiring:
The Cato Institute is looking for a passionate policy analyst to reform welfare and expand opportunities for low-skilled Americans. If you believe economic freedom is the path out of poverty—and want to dismantle the bloated and ineffective welfare state—you’ll thrive in this role.
The analyst will develop policy reforms that reduce federal spending, write and disseminate impactful research, and engage with media and policymakers to advance liberty-driven solutions.
This is a hybrid role primarily based in DC with a salary range of $70K–$110K depending on experience. Excellent benefits included.
In this edition, we examine inequality—what causes it, what works to reduce it, and what doesn’t:
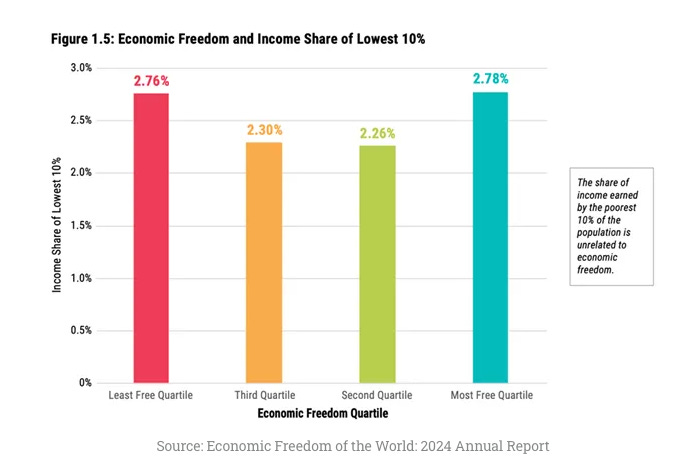
Markets, not forced redistribution, drove Latin America’s inequality decline in the 2000s. Juan José Casillas Quezada, a research assistant at the Center for Free Enterprise, writes: “[E]conomic freedom does not significantly change how much of the national income the poorest receive, but it does determine how big the overall income pie is.” He illustrates this point with Figure 1.5, which shows that a country’s level of economic freedom and the income share held by the poorest 10 percent are unrelated—challenging the critique that freer markets exacerbate income inequality. He further notes that inequality in Latin America declined between 2000 and 2014, but only 20 percent of the reduction came from government cash transfers: “Over half came from rising wages among the poor, driven by a period of robust economic growth fueled by global demand for Latin American commodities. In short, markets, when allowed to grow, delivered results where governments could not. Growth empowered low-income workers by expanding demand for their labor.” Quezada concludes: “If Latin America wants to reduce inequality in a sustainable way, it should stop trying to redistribute a small, stagnant pie, and instead focus on growing the pie through market-friendly reforms.”

Social spending exacerbates wealth inequality. In a 2019 blog, Cato’s Chris Edwards argued that “expanding social spending would magnify wealth inequality, not reduce it, because it would displace private wealth accumulation by lower- and middle-income households.” More social spending requires higher taxes, which reduces everyone’s ability to save—especially among lower-income households—thus increasing wealth inequality. “The bottom line for America is that expanding programs such as Social Security and Medicare will increase wealth inequality,” wrote Edwards. A recent Congressional Budget Office (CBO) study supports his arguments. It found that the top 1 percent held 33 percent of wealth in 2022—but when the present value of future Social Security benefits is included, that share drops to 27 percent. Meanwhile, “Social Security [...] accounted for more than 40 percent of the assets of families in the bottom half of the distribution and almost half of the assets of families in the bottom 25 percent.” In other words, conventional wealth inequality statistics overstate the concentration of wealth because they ignore the value of government benefits. At the same time, the CBO data reveals how much personal wealth Social Security displaces. For many middle-income Americans, benefits from the program come at the expense of private savings they would otherwise build on their own.
US income inequality is overstated. Cato’s John F. Early debunks a widespread misconception of outsized income inequality in the United States. He explains that Census Bureau statistics—which income inequality estimates are based on—exclude both government transfers and taxes paid by households. Specifically, the Census Bureau’s money income estimates exclude transfers such as the Earned Income Tax Credit (EITC), food stamps, and Medicaid—a total of $1 trillion missed in payments, which understates the incomes of lower-income households. The same data excludes taxes, and since higher-income households pay disproportionately higher taxes, income inequality statistics are artificially widened. The result of these omissions is significant: “The net effect is that pretax data overstate the true income of upper-income households by as much as 50 percent, and missing transfers understate the true income of lower-income households by a factor of two or more.“ As for international comparisons, the widely cited Gini coefficient—a measure of income inequality that ranges from 0 (no inequality) to 1 (total inequality)—overstates US income inequality compared to other countries, as these countries typically subtract taxes and add most transfers to income. “Adjusting for these missing elements [e.g., Medicaid and other transfers] reduces the [US] coefficient to 0.23 [from about 0.4], lower than that of any of the comparison countries,” writes Early.